Beneficiation experiment- Ore size analysis
Size of
the particle is an important consideration in Mineral Beneficiation because of the
following main reasons:
---Energy consumed for reducing the size of the
particles depends on size.
---Size of the particles determines the type of
size reduction equipment, beneficiation equipment and other equipment to be
employed. The size of the particle of standard configuration like
sphere and cube can easily be specified. For example, the size of a spherical
particle is its diameter (d) and that of a cubical particle is the length of
its side (l) as shown in Figure 1.
Figure 1 Spherical and cubical
particles.
As the mineral particles are irregular in shape, it
is difficult to define and determine their size. The size of a particle is
defined by comparison with a standard configuration, normally a spherical
particle.
Equivalent size or
equivalent diameter of an
irregular particle is defined as the diameter of a spherical particle which
behaves similar to an irregular particle under specified conditions.
Surface diameter is
defined as a diameter of a spherical particle having the same surface area as
the irregular particle.
Volume diameter is
defined as the diameter of a spherical particle having the same volume as the
irregular particle.
In mineral industry, the side of a square aperture
through which a particle just passes is taken as the size of the particle even
though little or no importance is given to its shape. Standard Test Sieves are
used in the mineral industry to measure the size of the small and the fine
particles, usually down to 74 microns.Test Sieve is
a circular shell of brass having an 8 inch diameter and being about 2 inch high
as shown in Figure 2.
Figure2 Test sieve
Sieve cloth is
made of wire, woven to produce nominally uniform cloth apertures (openings).
The sieve cloth is placed in the bottom of the shell so that material can be
held on the sieve.
Aperture (or
Opening) is a distance between
two parallel wires.
Mesh number is
the number of apertures per linear inch. Sieves are designated by mesh number.
Mesh size is
the size of an aperture i.e. the distance between two parallel wires. As mesh
number increases, mesh size decreases.
Sieve Scale is
the list of successive sieve sizes used in any laboratory, taken in order from
coarsest to finest.
Standard Sieve Scale is
the sieve scale adopted for size analyses and general testing work to
facilitate the interchangeability of results and data. In this standard sieve scale,
the sizes of successive sieves in series form a geometric progression.
For a standard sieve scale, the reference point is
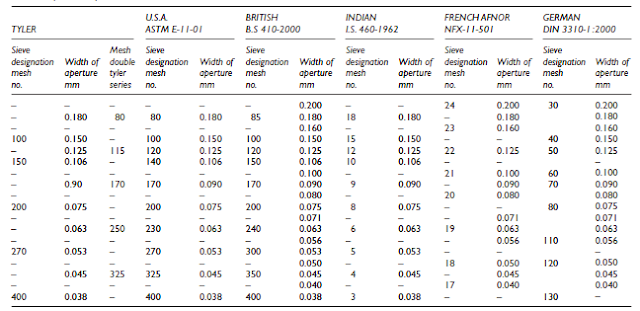
74 microns, which is the aperture of a 200 mesh woven wire sieve. There are different
standards of test sieves shown as table 1.
Table 1-1
Comparison of test sieves of different standards.
Table 1-2
Comparison of test sieves of different standards.
For most size analyses it is usually impracticable
and unnecessary to use allthe sieves in a particular series. For most purposes,
alternative sieves are quite adequate.For accurate work over certain size
ranges of particular interest, consecutive sieves may be used. Intermediate
sieves should never be chosen at random, as the data obtained will be difficult
to interpret. In general, the sieve range should be chosen so that no more than
about 5% of the sample material it retained on the coarsest sieve, or passes
the finest sieve. These limits may be lowered for more accurate work
1 SIEVE ANALYSIS
It is a method of size analysis. It is performed to
determine the percentage weight of closely sized fraction by allowing the
sample of material to pass through a series of test sieves.
Closely sized material is
the material in which the difference between maximum and minimum sizes is less.
Sieving can be done by hand or by machine. The hand sieving method is
considered more effective as it allows the particles to present in all possible
orientations on to the sieve surface. However, machine sieving is preferred for
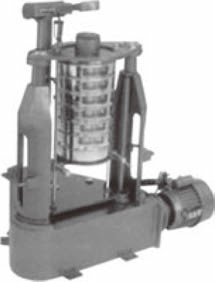
routine analysis as hand sieving is long and tedious. Table model sieve shaker
and Ro-tap sieve shaker (Figures 3 and 4) are the two principal machines used
in a laboratory for sieve analysis. Owing to irregular shapes, particles cannot
pass through the sieve unless they are presented in a favourable orientation,
particularly with the fine particles. Hence there is no end point for sieving.
For all practical purposes, the end point is considered to have been reached
when there is little amount of material passing through after a certain length
of sieving. Sieving is generally done dry. Wet sieving is used when the
material is in the form of slurry. When little moisture is present, a
combination of wet and dry sieving is performed by initially adding water.
Figure 3 Table
model sieve shaker.
Figure 4 Ro-tap sieve shaker.
2 TESTING METHOD
The sieves chosen for the test are arranged in a stack,
or nest, starting from the coarsest sieve at the top and the finest at
the bottom. A pan or receiver is placed below the bottom sieve to receive the
final undersize, and a lid is placed on top of the coarsest sieve to prevent
escape of the sample.
Figure 5 Sieve analysis at the end
of sieving.
The material to be tested is placed on the uppermost
coarsest sieve and closed with lid. The nest is then placed in a Sieve Shaker
and sieved for certain time. Figure 5 shows the sieve analysis at the end of
the sieving. The material collected on each sieve is removed and weighed. The
complete set of values is known as Particle
Size Distribution data. Particle size distribution refers to the manner
in which particles are quantitatively distributed among various sizes;in other
words a statistical relation between quantity and size. Particle size
distribution
data is presented in a tabular form as shown in
Table 2.The weight percentages of the material retained on each sieve are to be
calculated to form differential analysis. Cumulative weight percentage retained
is obtained from differential analysis by adding, cumulatively, the individual
differential weight percentages from the top of the table. Cumulative weight
percentage passing is obtained by adding, cumulatively, the individual weight percentages
from the bottom of the table.
All the fractions are fairly closely sized (except
first fraction). Hence the size of the particles in each fraction may be
calculated as arithmetic mean of the limiting sizes.
Table 2 Particle size distribution
data from size analysis test
3.PRESENTATION OF PARTICLE SIZE DISTRIBUTION
DATA
Particle size distribution data is best presented
for use in the form of graphs (Figure 6). The simplest method is to plot a
histogram of the weight percent of the material in the size interval against
the size interval. When the size intervals are small enough, the histogram can
be presented as a continuous curve taking the middle points of the histogram. In
other words, a graph is plotted between the weight percent of the material as
ordinate and the arithmetic mean size as abscissa. It is called a linear scale frequency plot. It gives the quantitative
picture of the relative distribution of the material over the entire size
range. In many cases, the data is more commonly plotted as cumulative weight
percent passing versus actual size of opening. It is called a linear scale cumulative plot.
Figure 6 Graphical presentation of
particle size distribution data.
The same graphs can also be drawn on semi-logarithmic
graph paper for satisfactory spreading of the data on fine size region. 80% passing size (D80) is the size of
the sieve at which 80% of the particles pass through that sieve. 80% passing
size can be determined from the plot of cumulative weight percent passing
versus sieve size as shown in Figure 7. F80
is the 80% passing size of the feed material. P80 is the 80% passing size of the product material. 80% passing
size is used in all calculations to determine energy requirements for reducing
the size of the particles by comminution equipment.
Figure 7 Plot for determination of
80% passing size D80.
4.APPLICATIONS OF PARTICLE SIZE DISTRIBUTION
DATA
1 Comparative efficiencies of comminution units by
relating the work done and the product sizes can be studied.
2 Particle surface areas can be calculated from
size analysis.
3 Power required to crush and/or grind an ore from
a given feed size to a given product size can be estimated from size analyses
of the feed and the products.
4 The calculation of the sizing efficiency of a
classifier or cyclone can be closely estimated from size analyses of the feed
and the products.
5 SUB-SIEVE SIZING
Sizing of the particles having size less than 40
microns is known as Sub-sieve sizing.
The particles at fine sizes are termed as slimes
and d colloids. The table 3 are the approximate size ranges of different
particles
Table 3 Approximate
size ranges of different particles
Size analysis methods used for the particles less
than 40 microns are shown in Table 4.
Table 4 Size analysis methods for
sub-sieve sizing.
Sedimentation and elutriation techniques are based
on the settling behaviour of the particles of various sizes and the analysis is
made by separating the particles into various size fractions. Microscopic
sizing is similar to measurement with a yardstick. The particles are sprinkled
on a glass slide or mounted in some way on a slide and the size of individual
particles is measured under the microscope. Laser beam particle size analysis
is of recent origin. The PSM system has been installed in several Mineral Beneficiation
plants for continuous measurement of particle size.
In industry, classifiers and hydrocyclones are used
for sizing sub-sieve size particles. Fine particles are more difficult to
handle and beneficiate. Greater stress is to be given on the process of fine
particles not only to recover the values but also to control pollution.


评论
发表评论